Causal Analysis for Startup Planning
Using Causal Analysis to Prove a Business Plan Before Starting the Company
The popular notion of a startup is an entity built to create something new under conditions of extreme uncertainty [Ries 2011]. Eric Ries, author of The Lean Startup, writes, “We must learn what customers really want, not what they say they want or what we think they should want.” The way he proposes to do that is to learn faster than anyone else. His advice is to fail, learn, adjust, and repeat.
Companies such as Dropbox, Airbnb, Uber, and Spotify use the lean startup model to create massive success. Their ability to try, fail, and learn in an iterative cycle led to building products and services that solve specific problems with great accuracy. However, is it possible to create a successful business without repeatedly failing? Can one build a company that finds product-market fit on day one or even ten?
The Journey of Airbnb
The best companies start with an idea based on solving a specific problem for a particular population. It is usually a problem the founder has experienced themselves. For example, Brian Chesky and Joe Gebbia could not make their San Francisco rent when the idea for Airbnb surfaced.
“You guys are crazy. There’s going to be a murder in one of these houses. There’s going to be blood on your hands. I am not touching this with a 10-foot pole.”
Facing eviction, Chesky and Gebbia decided to rent out air mattresses on the floor of their apartment when all of the hotels for the conference were booked. They called the service “Air Bed and Breakfast.”
However, the journey from Air Bed and Breakfast to Airbnb was perilous. Early on, investors would not even meet with them [Gallagher 2017]. Instead, the feedback became, “You guys are crazy. There’s going to be a murder in one of these houses. There’s going to be blood on your hands. I am not touching this with a 10-foot pole.”
The success came later, after Y-Combinator, spending time with their customers in New York, and the famous Craigslist hack. The early investors dismissed that one can use their home as a revenue stream for the first time. This is the product market fit — a perfect solution to the problem. Not only does it help people pay for their homes, it can become an additional source of income.
Decks and Models
Often, the first two things to come from a business idea are a pitch deck and a financial model. The deck is a PowerPoint presentation that explains the problem, a solution, the product, the market size, and the team, followed by an ask for some amount of funding. A financial model is a spreadsheet of assumptions that calculates Profit and Loss, Balance Sheet, and Cash Flow statements from now until sometime in the future.
However, neither document proves that the problem exists or that the solution proposed will work. Instead, it is just an educated guess based on preliminary research such as early adopter purchases or user surveys. At its core, this is a theory.
The Experiment
If our business idea is a theory, we need an experiment to prove or disprove it. To do that, we must start with a question [Huntington-Klein 2022]. Economist Nick Huntington-Klein describes a research question as “well-defined, answerable, and understandable.” A question that is answered with believable evidence. Step one is to define the research.
Following the lean startup methodology, we must uncover what our customer wants. Before we can begin, we need to define who our customer is. Selecting any potential customer base reveals plenty of problems that could be solved. Some of these issues may have solutions or partial solutions already in place. For example, Airbnb was one of many companies to provide short-term property rentals.
The difference between Airbnb and other short-term rental providers, such as hotels, is that it provides income to anyone with a living space. First-time homebuyers, apartment renters, and empty nest retirees can earn money from their dwellings.
Airbnb’s original experiment allowed the two co-founders to remain housed during a difficult time. However, it is hard to determine from their experience if the model is repeatable. Would other people be willing to rent our space in their homes? This is the answer a founder needs to answer very quickly before moving forward.
Evidence And Correlations
Once a question is defined, we can use data to determine how to solve it. However, if we rely on data alone to determine the solution, we end up with something similar to Huntington-Klein’s shorts and ice cream dilemma [Huntington-Klien 2022]. The number of people wearing shorts remarkably predicts ice cream sales. The caveat is that people do not buy ice cream because of shorts but because it is hot outside.
“The relationship between two variables shows you what learning about one variable tells you about the other.”
For this reason, we need an experiment that determines the relationship between two or more variables [Huntington-Klein 2022]. Huntington-Klein explains, “The relationship between two variables shows you what learning about one variable tells you about the other.” However, an association between two variables does not always mean a causal relationship. We must move beyond correlational to find the supporting evidence for our possible solution.
Causal relationships can be viewed as evidence. This can be the source of the problem we want to solve or the proof that our proposed solution will work. However, it is only as good as the experiment we devise.
Experiment Design
The scientific method to build an experiment uses five criteria to test for feasibility [3]. For example, during the early days of Airbnb, they could have designed an experiment to determine if people would rent space in their homes. Starting with a theory that people facing eviction would most likely rent space, they could design an experiment.
Using the criteria from Huntington-Klein, we can test the practicality of such an experiment before moving forward [Huntington-Klien 2022].
- Consider potential results that might come from the experiment
- Consider the feasibility of acquiring the data needed.
- Consider scale in terms of time and resources required to answer the question.
- Consider the design of the experiment to ensure it results in an answer.
- Keep it simple by answering one question per experiment.
Our Airbnb example begins with the original reason for the co-founders renting space. That is money for rent. Thus, the hypothesis is that a person needing money will most likely rent out their home for a few nights. So we need to answer the question, “Is a person in a financial bind the best user for Airbnb?”
Using the lens of Huntington-Klein’s criteria [Huntington-Klien 2022], we have the following:
- The potential result is a yes or no to our question. They either submit a listing or they do not.
- We can obtain data by posting flyers in common areas of apartment complexes.
- Posting flyers in 15,000 apartment complexes in San Francisco is not feasible. Therefore, we need to narrow the experiment to only those apartments with young college graduates. A population similar to the founders.
- What do we print on the flyers, and how do we collect the data?
- Will this answer our question with compelling evidence?
From the criteria, posting flyers with a call to action inside apartment building common areas is an excellent experiment to answer the question. However, it cannot answer if this user group is the best for Airbnb. It can only determine if this is a feasible user group for Airbnb. To find the best population, one must create experiments for each group. For example, young apartment owners, new homeowners, retirees, and vacation homeowners, to name a few.
Causal Inference
Economist Scott Cunningham explains Causal Inference as “the leveraging of theory and deep knowledge” to estimate the impact of events and choices on a given outcome [Cunningham 2021]. For example, there is a correlation between shorts and ice cream, but the cause is heat, not shorts-wearing.
A causal effect compares two states of an event [Cunningham 2021]. In one state, an action occurred that was absent in the other. This represents the counterfactual or “what if” in causal reasoning. Considering our Airbnb example, in scenario one, we post flyers in apartment complexes and see a spike in rentals over the next week. In scenario two, we send emails to vacation homeowners instead and then compare the change in rentals.
The DAG
The easiest way to represent a causal relationship is using a Directed Acyclic Graph (DAG). This is a one-directional illustration of nodes and arrows where the direction of the arrow dictates the direction of causality [Cunningham 2021]. Cunningham explains, “Think of a DAG as like a graphical representation of a chain of causal effects.”

Casual effects occur in two ways: direct (D causes Y) or resulting from a third variable (X causes D and X causes Y). Such paths are called backdoor paths, where non-direct paths are not causal [Cunningham 2021]. Cunningham describes, “the bit of the correlation between D and Y is purely spurious.”
The backdoor path is problematic because it reveals noncausal correlations between the causal variables. An experiment that results in backdoor paths will not be limited to just the causal variables. Instead, one must design research so that all backdoor paths are closed. In our Airbnb example, posting flyers at apartment complexes increases the number of listings and the number of rentals.

Was it the flyers that increased rentals directly or the additional listings appealing to a larger group of potential renters? Just by intuition, it is clear that the rentals increase, and the number of flyers posted is not causal. It is correlated since we can demonstrate that rentals on the website do not make more posted flyers. On the other hand, the number of listings has a causal relationship with the number of rentals. For example, stopping the addition of flyers to apartment buildings and watching the resulting change in rental rates.

In a DAG, the absence of arrows indicates no causal relationship exists. Thus, the diagram above illustrates that more flyers posted causes more listings, which causes more rentals. We cannot isolate the variables to measure the causal relationship if we stop posting flyers but perform an email campaign or other marketing activity.
Probabilities and Causation
Behind each arrow of our DAG is a probability [Pearl 2018]. However, probabilities like P(Y | X) can only answer questions where data exists. Pearl explains, “While probabilities encode our beliefs about a static world, causality tells us whether and how probabilities change when our world changes.”
Bayes’s rule:
P(S | T) P(T) = P(T | S) P(S)
It states that if we know the probability of S given T, we should be able to determine the likelihood of T given S [Pearl 2018] — a general solution to the inverse probability problem that updates beliefs in response to new evidence.
Bayesian Networks
We can graph an experiment’s cause and effect probabilities inside a DAG to produce a Bayesian network. This is a directed acyclic graph in which each edge corresponds to a conditional dependency, and each node corresponds to a specific variable.
These relationships, represented by arrows, flow in one direction of influence. The information about one node changes how information propagates to other nodes [J. Puga, M. Krzywinski, Altman 2015]. A cycle is not allowed because it represents a noncausal relationship.
In the Airbnb scenario of passing out flyers at apartment complexes, we can graph the probabilities of flyers to listings, listings to rentals, and flyers to rentals.
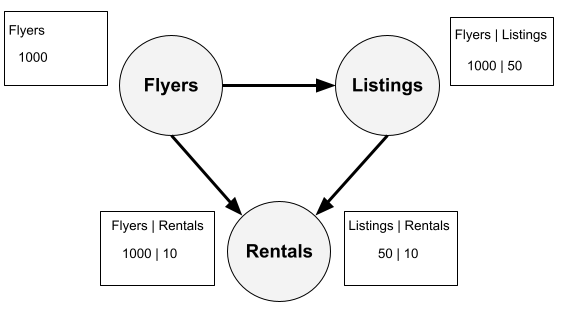
This example does not cycle; each node is a unique variable, and each arrow represents conditional dependency. By including the probabilities, we can quickly determine the relationships between each node and understand that flyers to rentals are a much weaker relationship than listings or vice versa.
Pearl’s Ladder
Turing Award winner Judea Pearl describes the concept of a causal ladder as seeing, doing, and imagining [Pearl 2018]. The first rung is association through observation. Here, one might ask, “How would seeing X change my belief in Y?” Next is the second rung of intervention. This level requires action based on the question, “What would Y be if I do X?” Last is the level of counterfactuals. Here, one contemplates, “Was it X that caused Y?”

Pearl argues that the three tiers correspond to “progressively more powerful causal queries.” First, we are determining patterns from our observations and making predictions. At this tier, Pearl explains, we can answer questions like “How likely is a customer who bought toothpaste to also buy dental floss?” A conditional probability.
Moving upward to intervention, Pearl explains that the following question can be answered, “What will happen to our floss sales if we double the price of toothpaste?” This level involves changing the question to one incapable of answering with data alone.
The final tier is the counterfactual or “what if” level. Pearl explains a more complex question: “What is the probability that a customer who bought toothpaste would still have bought it if we had doubled the price?” It involves the comparison of actual events with imagined ones. This is the area where startup founders find themselves.
Intervention
The intervention step on Pearl’s ladder involves predicting the effects of actions or events that have yet to occur. To calculate an intervention, we use Pearl’s do operator. Instead of P(Y | X=x) representing the probability of Y given an observation of X=x, we use P(Y | do(X=x)) to represent the probability of Y given an intervention in x [S. Talebi].
To determine intervention, we begin with a DAG, just as before. We are trying to satisfy the Markov Condition to identify the causal effects. This is a two-part test. The graph must be acyclic, which is all DAGs [S. Talebi]. Two, no variable in the DAG simultaneously causes two variables. Once we satisfy the Markov condition, we can express any intervention via observations.
We illustrated interventions with our DAG in our Airbnb example of passing out flyers. Proving that handing out flyers increased listings and listings increased rentals.
Go To Market
Intervention is a core piece of a Go To Market (GTM) strategy. Here, we must answer what sales would be if I advertised in a specific way. We use advertising to refer to any lead-generation activity. It can be graphed as follows:

A lead is a person you can contact. An engaged lead is someone who shows interest in your stuff [A. Hormozi 2023]. The offer is what you promise to give in exchange for money. In our graph, advertising causes leads, leads causes engaged leads, and engaged leads causes sales.
We can break it down into advertising to leads and offers to sales. Moving from a generic process to a specific plan, we must test advertising by each type we will try.

By running experiments for each type of advertising we seek to use, we create the data needed to determine the best method. While the answer will become evident for lead generation, the objective measure is the number of engaged leads. For that, we build a graph similar to the one below.

An experiment will give us a good idea of how much of each activity is required to generate leads. However, the measure of engaged leads is much more challenging to measure. For this, the copy, the offer, the visuals, and the population reached must be considered. It is not simply taking a smaller percentage of leads to estimate engaged leads. Because some channels may have zero engaged leads with many leads.
Counterfactuals
The real question for a GTM is what caused the engaged lead. These are the people interested in your stuff [A. Hormozi]. Outside of trial and error, we can use the tools of Pearl’s Causal Analysis to maximize our advertising.
“Data can tell you that the people who took a medicine recovered faster than those who did not take it, but they can’t tell you why.”
“Counterfactual reasoning, which deals with what-ifs, might strike some readers as unscientific,” explains Pearl. This is because there is no easy way to calculate a what-if. Bayesian networks use “shades of gray” but still do not understand cause and effect. Pearl elaborates, “Data can tell you that the people who took a medicine recovered faster than those who did not take it, but they can’t tell you why.”
Pearl describes how to derive counterfactuals from a structural model using a three-step process as follows [Pearl 2018]:
- Abduction: Use data to estimate
- Action: Use the do-operator to change the model with counterfactual assumptions
- Prediction: Calculate using the resulting model
We can build a GTM strategy for each type of advertising we seek to try. That way, we can reduce the time needed to complete each channel’s campaign.

Step 1: Assuming linear functions, we can use a statistics method to find the best-fitting linear equation. EL = fs(AV, LD, Us) where EL is for engaged leads, AV is for advertising volume, LD is number of leads, and Us represents unobserved variables that affect engaged leads.
For example, if we observe from the email campaign experiment that after sending 100 emails we obtain 25 leads. In that case, we can substitute these values into the equation above as AT(Email) = 100 and LD(Email) = 25. This will determine the unobserved factors Us(Email).
Step 2: Use the do-operator to remove the arrows pointing to the variable set to a counterfactual value [Pearl 2018]. Here, you isolate each variable that may contribute to the number of engaged leads — for example, email copy, product name, etc. In our current model, there is no arrow to remove. Therefore, we can adjust the Us(Email) to something we believe has an effect.
For example, if we believe that email copy affects campaign effectiveness, we can perform an A / B test where email copy is 0 for A and 1 for B. Let’s set the Ucopy to 1. To test the first version, calculate the same with Ucopy = 0. Then, give a value to account for unknown variables of Us. If we believe that changing the copy from A to B will result in 5 new engaged leads, then we can set Us=5.
Step 3: We update the model to reflect the new information [Pearl 2018]: Ucopy = 1 and Us = 5 so that:
ELcopy=1 (Email) = 100 x 0.25 x 0.25 + 5 = 11.25 or 11 for our purposes
The result of 11 engaged leads for every 100 sent using the B copy from the A / B test is probably a reasonable estimate. Notice the assumption of 25%. We can predict the outcome of our campaign using the combination of data from the experiment with a model. Once we have engaged leads, we can improve the model to make better future predictions.
The Startup Experiment
Sales in an early-stage company come from evangelical management and product marketing [Kazanjy 2020]. This work does not scale — for example, performing an on-site sales demonstration for a low-cost product. These activities aim to learn enough to build an effective, scalable method.
Salespeople are good at matching a known persona to a known solution. However, they will fail hard when selling a partially completed product to an unknown user base. This is why early-stage companies must learn fast. We will structure our first days, weeks, and months as experiments to do that.
As we read above, Huntington-Klein declares that for an experiment to be successful, it must adhere to the following:
- Consider potential results that might come from the experiment
- Consider the feasibility of acquiring the data needed.
- Consider scale in terms of time and resources required to answer the question.
- Consider the design of the experiment to ensure it results in an answer.
- Keep it simple by answering one question per experiment.
We need to do this for our company experiment for every piece, from development to product-market fit to naming to marketing to sales, and do it fast. The biggest threat to a young company is time. Someone else is working on something similar to you right now. Another competitor just raised a funding round three times what you think is possible. An established leader is scheduled to release a competing solution in 6 months.
About the Author
Todd Moses is the Co-Founder and CEO of Estimand Inc., an Ingredients Exchange with the mission to stabilize the world’s food supply. He lives with his wife and youngest son in Raleigh, North Carolina. You can reach Todd by email at toddm@estimand.ai.
References
[1] E. Ries, The Lean Startup, (2011), Crown Currency
[2] L. Gallagher, The Inside Story Behind the Unlikely Rise of Airbnb, (2017), Knowledge at Wharton Podcast
[3] N. Huntington-Klein, The Effect. An Introduction to Research Design and Causality, (2022), CRC Press
[4] S. Cunningham, Causal Inference. The Mixtape, (2021), Yale University Press
[5] J. Pearl, D. Mackenzie, The Book of Why, (2018), Basic Books
[6] J. Puga, M. Krzywinski, Altman, N. Bayesian networks. Nat Methods (2015), Nature
[7] S. Talebi, Causal Effects via the Do-operator, (2022), Towards Data Science
[8] A. Hormozi, $100M Leads: How to get strangers to want to buy your stuff, (2023), Acquisition.com LLC
[9] P. Kazanjy, Founding Sales. The Early Stage Go-to-Market Handbook, (2020), Peter Kazanjy